Cleaned and transformed raw business data in MySQL using advanced SQL queries, handling missing values,
duplicates, inconsistent formats, and outliers to prepare a reliable dataset for analysis and reporting.
This MySQL EDA project analyzes a global layoffs dataset to identify key trends across industries, companies, and time periods. The analysis highlights major patterns in workforce reductions.
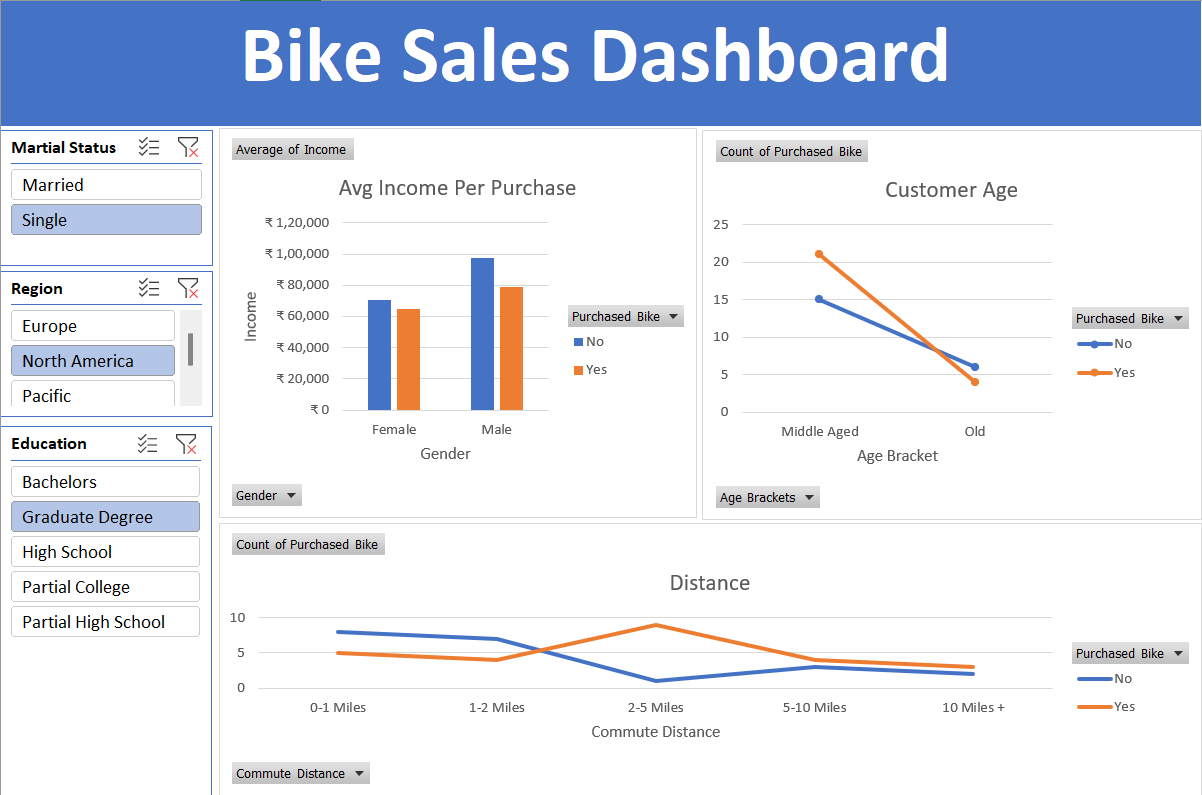
This Excel dashboard uses pivot tables and charts to analyze bike sales trends, top products, and regional performance, providing clear insights for data-driven decisions.
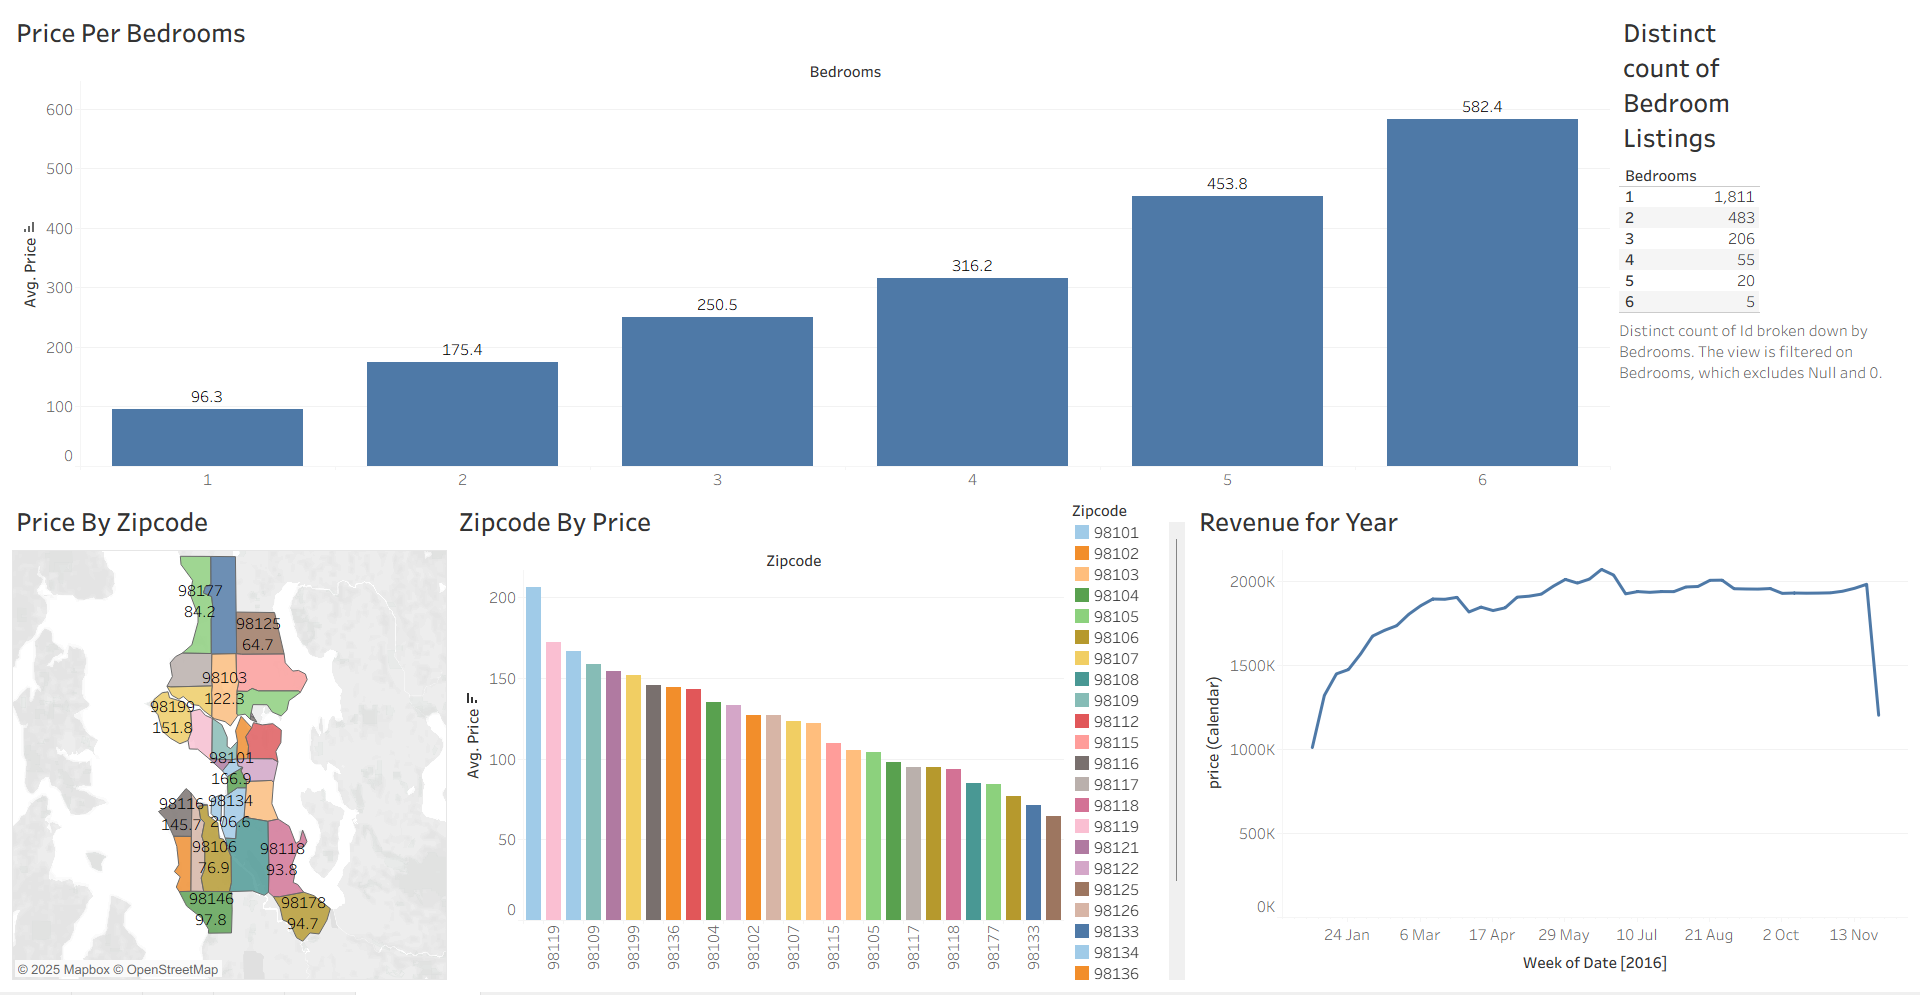
This Tableau dashboard visualizes Airbnb data to highlight booking trends, popular properties, and pricing insights.
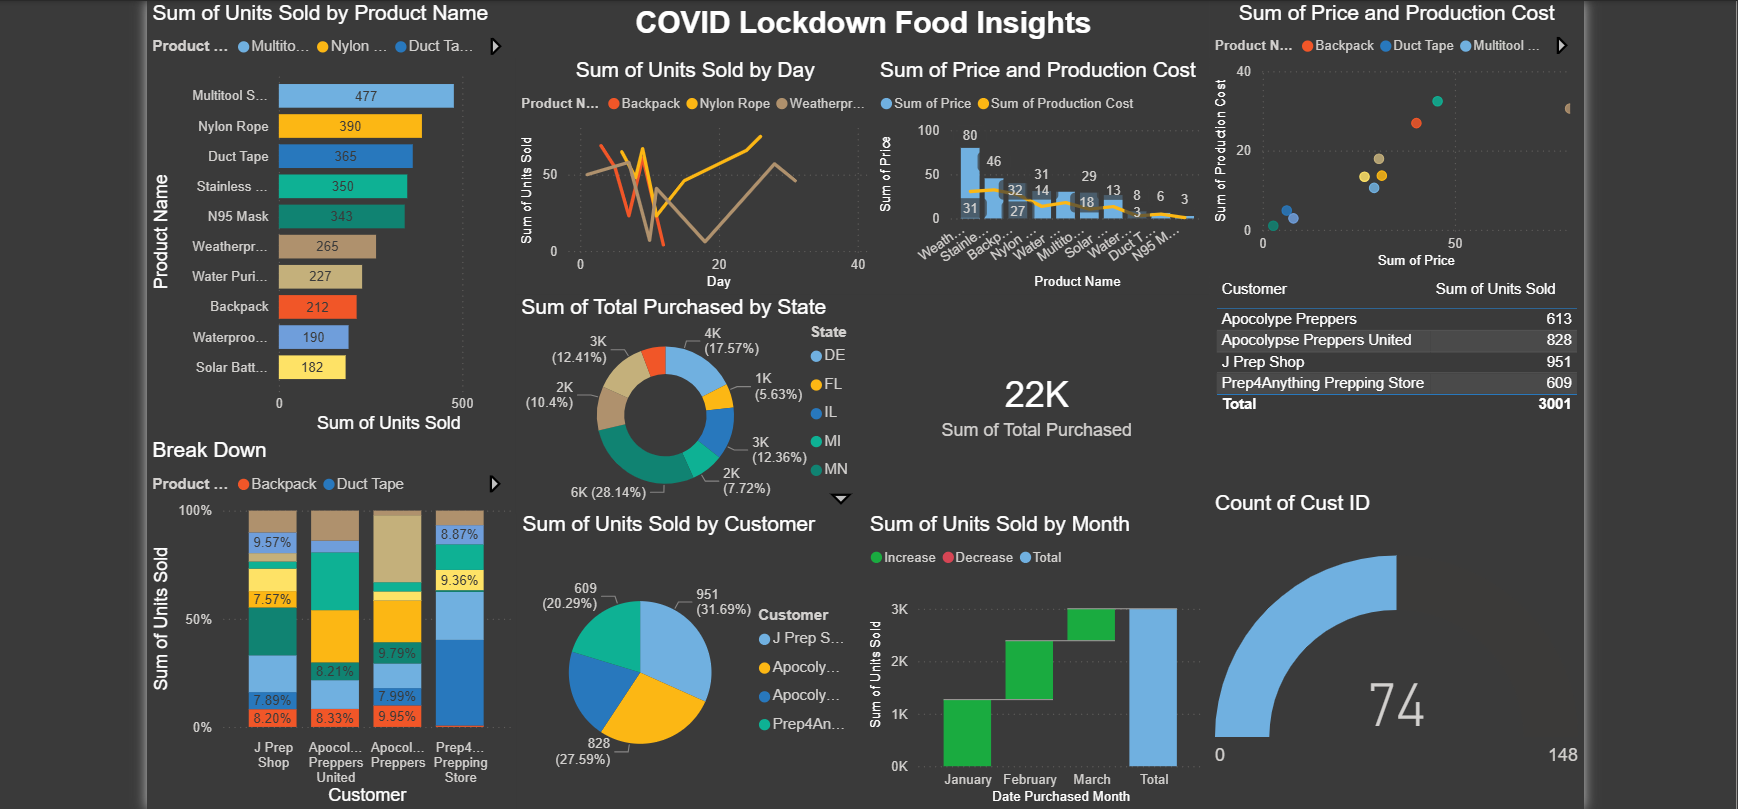
Analyzed consumer food buying trends during COVID lockdown using interactive Power BI dashboards. Visualizations highlight popular stores, preferred items, and shifting purchase patterns to provide actionable business insights.
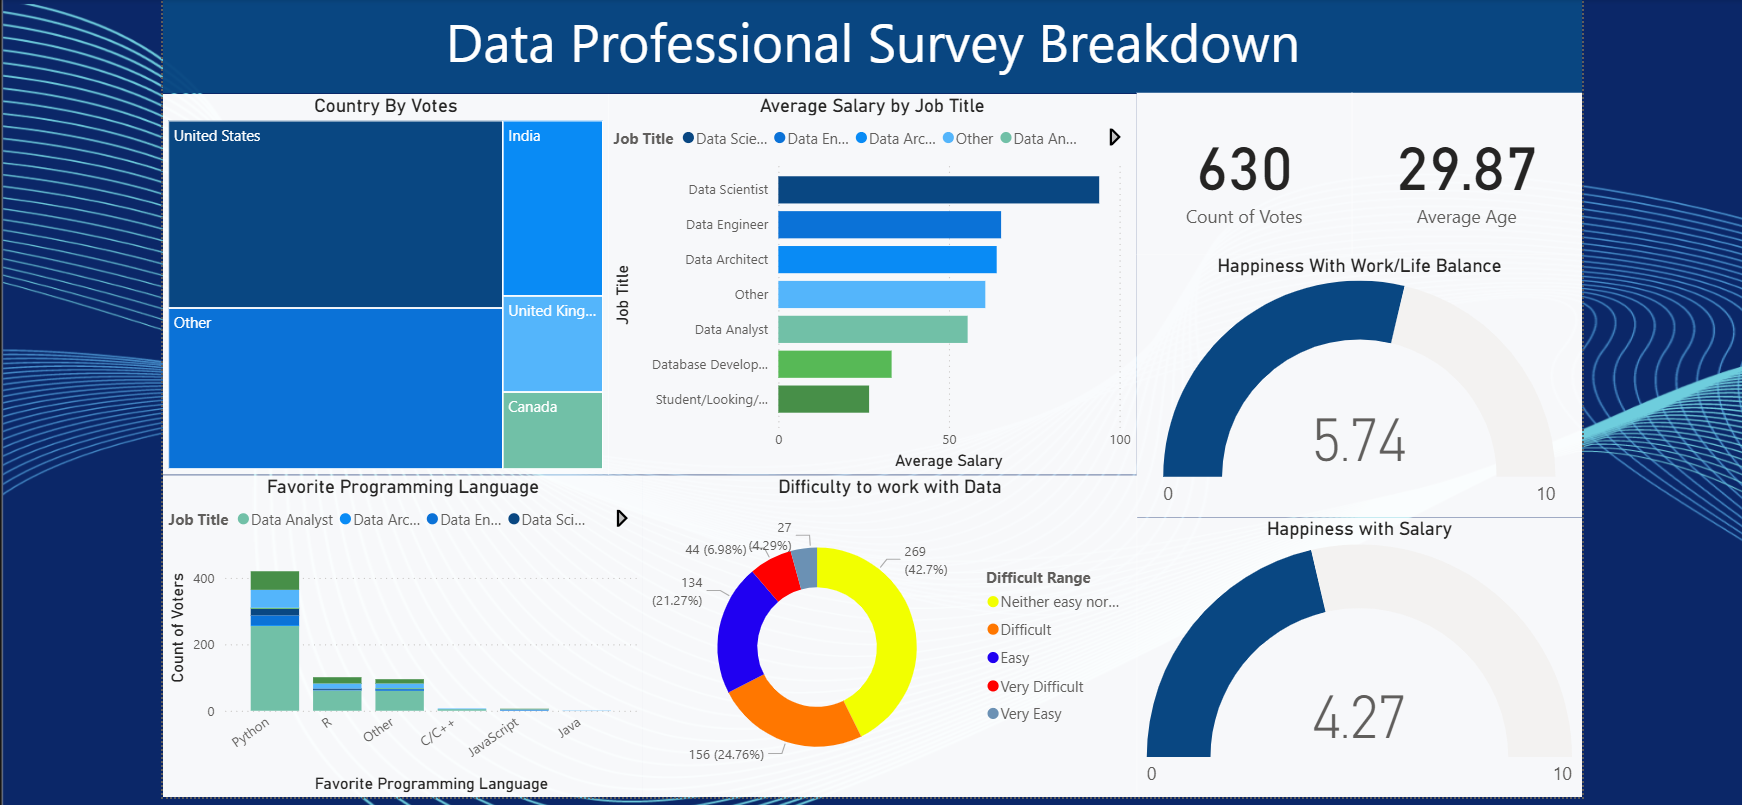
This Power BI dashboard visualizes career choices across various data roles, providing interactive insights and highlighting trends, preferences, and emerging opportunities in the data field.

This project uses Python and web scraping to track Amazon products and their prices. It automatically sends an email alert when a product’s price drops, helping monitor deals and price changes efficiently.

This project fetches live cryptocurrency data using a custom API I built. It highlights real-time data handling in Python along with secure and efficient API integration.

This project focuses on cleaning messy datasets using Pandas. It includes handling missing values, fixing inconsistent formats, removing duplicates, and preparing data for accurate analysis and visualization.

This project demonstrates Exploratory Data Analysis (EDA) using Pandas, focusing on data cleaning, summarization, and visualization to uncover patterns, trends, and insights from the dataset.

This project involves scraping data from a Real website, organizing and displaying it using Pandas, and exporting the cleaned data to CSV and Excel formats for further use.
Python BMI calculator that computes body mass index from height and weight and categorizes health status.

File Sorter is a Python-based tool that automatically organizes files into folders by type or custom rules, making digital file management fast, easy, and efficient.
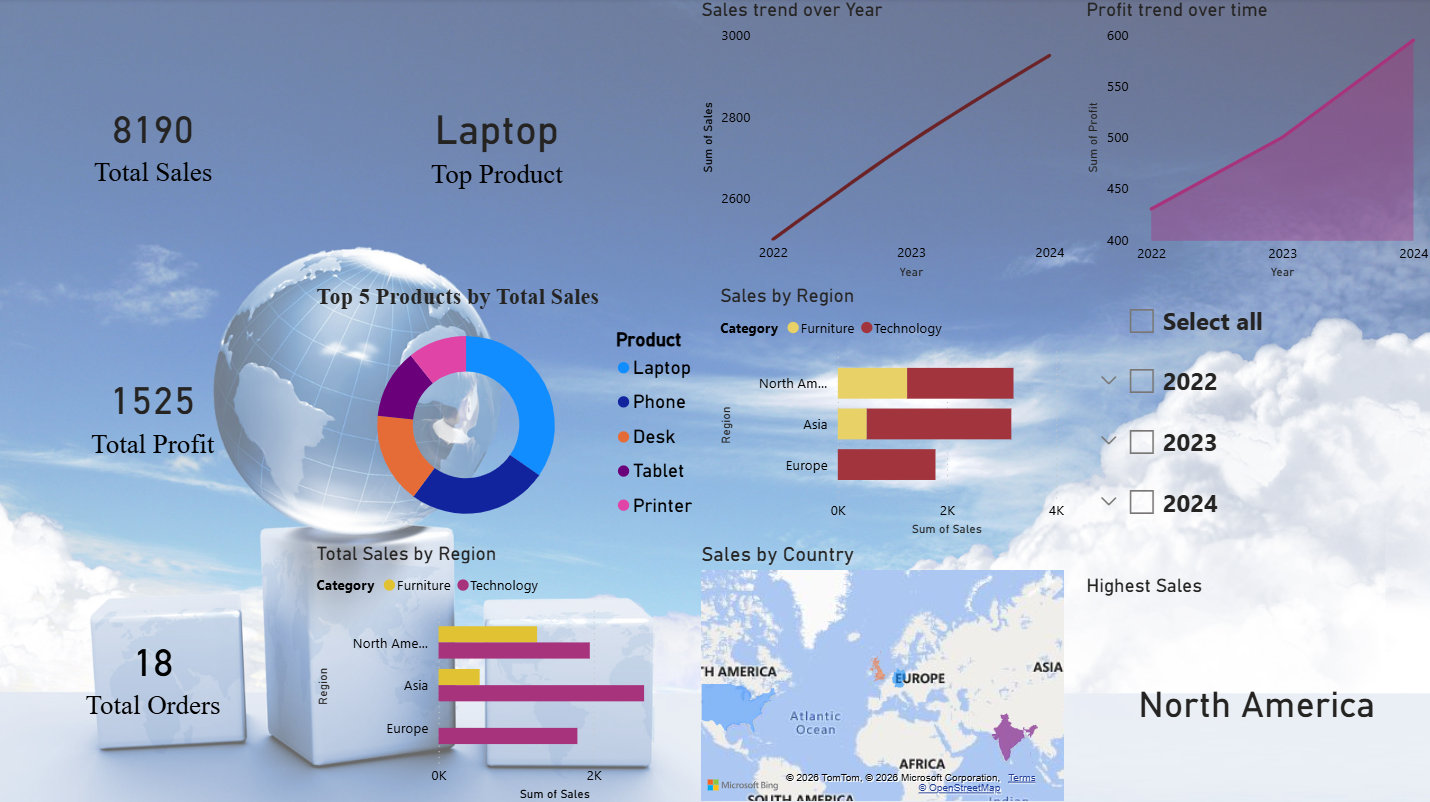
This interactive Power BI sales dashboard highlights key business metrics, including total sales, profit, and orders. It visualizes sales trends over time, top-performing products, and regional performance, enabling quick insights and data-driven decision-making.

This Power BI dashboard highlights key patterns in global terrorism, showing where attacks occur most and which methods and groups are most effective, providing clear insights into evolving trends.